Download the full results in PDF and Excel format
Academics love what they do but hate the way that their profession is changing – right? And professional and support staff are more empowered than ever; in fact, they are running the show – correct?
If you were to listen only to the more voluble critics of the state of the higher education workplace in 2014, you could be forgiven for holding such black and white views. The reality, of course, is far more nuanced.
This week, for the first time, Times Higher Educationcan publish an overview of how the individuals who work in our universities, across all ranks and roles, feel about their jobs.
What do staff think about their department, their colleagues and their institution? Do they feel included in management decisions, do their employers listen and respond to their ideas and concerns? Do they feel motivated or downtrodden? And what factors influence their well-being at work? THE’s inaugural Best University Workplace Survey aims to answer all these questions and more.
Over the course of several months in 2013, more than 4,500 higher education staff from 150 institutions across the UK completed our online survey.
Participants also provided detailed commentary on the issues that mattered most to them in the workplace, choosing to leave more than 6,500 comments on many of the issues raised.
All participants were verified as working in UK universities, with 45 per cent classifying themselves as “academics” and 55 per cent holding “professional and support” roles.
Having analysed the responses and crunched the numbers, THE can now publish one of the most detailed reports on the UK’s higher education workforce ever produced.
The survey reveals that:
- Most university staff find their job rewarding and the majority feel proud to work for their institution
- There is notable concern among many academics about the performance of university leaders, with almost half expressing dissatisfaction
- More than half of academics are content with their salaries, while just over a quarter are not
- Academics from different disciplines have very different views on whether their subject is valued
- One in three respondents feels that their job is not secure
- There are concerns among some staff about bullying in the workplace and about the sector’s use of zero-hour and fixed-term contracts
- Almost half of academics feel unable to make their voices heard in their institution.
John Gill, editor of THE, says: “The pages of THE are filled week in, week out with the issues affecting the working lives of university staff, so we are delighted that so many of our readers have participated in such a detailed study of what universities are doing right and the areas in which they need to improve as employers.
“Almost 400,000 people work in our higher education sector, so the findings of this THE survey relate to a huge – and hugely important – group of people.
“This is the inaugural year of the poll, and as with any survey it can only offer a snapshot of attitudes across the sector as a whole; but the trends that it identifies make for fascinating reading and should give decision-makers in our universities plenty to think about, as well as giving a much-needed voice to staff at all levels.”
Yiannis Gabriel, chair in organisation studies at the University of Bath School of Management, who helped to develop the survey, adds: “Academics, professionals and support staff working in universities have, for the first time, had an opportunity to express their views about their work and their institutions.
“I feel quite proud about its potential contribution to discussions about the future of higher education in this country, to say nothing about its value as a research instrument into the quality of working life in UK universities.”

Source of satisfaction
“It is good to see the positive things that are reflected in the results – lots of staff are getting a great deal of satisfaction from their jobs,” says Matthew Andrews, academic registrar at Oxford Brookes University and chair of the Association of University Administrators.
Overall, the university sector’s workforce does appear to be predominantly content with their vocation, with 81 per cent of respondents agreeing that their work is a source of satisfaction. (Note that figures for “agree” and “strongly agree” have been added together, as have the figures for “disagree” and “strongly disagree” in other analyses in the article. For the full breakdown, click here.) Academics are more likely to derive satisfaction from their work (85 per cent) than those in professional and support roles (78 per cent).
“In my experience, most people in academic or professional and support roles are there because they value how higher education can benefit individuals, benefit societies and improve people’s lives,” Andrews says.
So perhaps it is not surprising that nearly three-quarters of those who completed the survey say they find their job rewarding (73 per cent). The proportion is slightly higher among academics (75 per cent) than for professional and support staff (71 per cent). For academics, teaching and research are both sources of satisfaction (78 and 80 per cent, respectively).
Two-thirds of employees (66 per cent) also agree with the statement “I am proud to work in my current university”, although professional and support staff (70 per cent) are more likely than academics (60 per cent) to do so. “I think this reflects the fact that many academic staff have a great loyalty to their discipline rather than just their institution,” Andrews says of this discrepancy.
Work-life balance out of kilter
Although most university staff enjoy their role, it is clear that there is huge variation in how people feel they are treated by their employer; a significant proportion of respondents raise concerns about their workload and the impact of their job on their health.
Nearly a third of staff (32 per cent) say they feel their job is having a negative impact on their health, with 50 per cent saying it is not. Academics (39 per cent) are more likely than professional and support staff (26 per cent) to feel that their health is negatively affected by their work. This issue also attracted comment from participants, with one academic at a Welsh university, for example, describing “extremely high rates of stress-related health problems” at her institution and another, at a Scottish university, claiming that “impossible” demands are placed on academic staff while the university takes “no real interest in staff health/well-being”.
Gabriel says the survey brings to light the wide variation in circumstances that the higher education workforce experiences. “Academia is neither an unspoiled Garden of Eden nor a set of ivory towers, nor is it a ruthless labour camp of joyless toil,” he says.
“Universities, as a whole, offer those who work in them opportunities to grow as people and to do work they enjoy and value, but they also make serious demands on them, at times exacting a heavy toll on their physical and mental well-being.”
His colleague Rob Briner, professor of organisational psychology at the University of Bath School of Management, also helped to inform the content of the Best University Workplace survey.
“The results show a group of staff who, on the whole, find work satisfying and rewarding but at the same time feel their work can be bad for their well-being and work-life balance,” he explains. “This mix is typical of employees who identify strongly with the purposes of their organisations but who are at the same time feeling overworked, under-valued and sometimes exploited.”
Workload was seen as a particular problem, with 47 per cent of respondents saying that they spend “too much time working”. Academics were far more likely to feel this (63 per cent) than those in professional and support roles (33 per cent).
On a similar note, just over half of university employees (51 per cent) say that they feel their university takes advantage of them (62 per cent of academics; 42 per cent of professional and support staff), with most (73 per cent) saying they often work more than their contracted hours (86 per cent of academics; 62 per cent of professional and support staff).
However, more than half (56 per cent) of all staff believe that the workload assigned to them is “reasonable” (46 per cent of academics, 64 per cent of professional and support staff).
Although a significant proportion of staff are putting in extra hours, only 37 per cent say that when they do so, it is acknowledged by their manager. Few academics say that their extra work is acknowledged (22 per cent) compared with those in other roles (50 per cent).
One Russell Group academic responds: “Front-line staff are badly overworked and do not receive any additional compensation, recognition or even a thank you for their efforts.”
Another, from a specialist London institution, adds: “The workload is far in excess of contracted hours and this is only given passing acknowledgement by line management, who seem content to allow the situation to prevail despite being informed.”
Overall, just over a third of all respondents (34 per cent) believe that their working responsibilities do not allow them a healthy work-life balance, with 48 per cent taking the opposite view. Again, academics (49 per cent) are much more likely than those working in professional and support roles (22 per cent) to feel that their workload denies them a balanced lifestyle.
Is your subject valued?
The survey reveals some strikingly different responses from academics working in different subject areas.
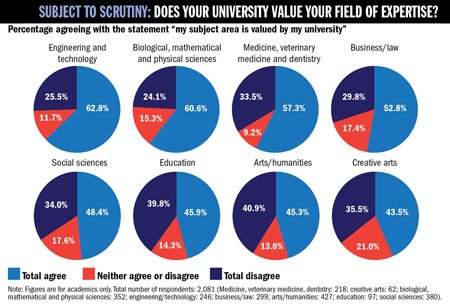
Asked whether they feel that their subject area is valued by their university, more than half of academics (53 per cent) say they feel it is, while a third (32 per cent) do not.
But academics working in engineering and technology are the most likely to feel that their subject is valued by their institution, with nearly two-thirds (63 per cent) saying their discipline was important to their university. The figure is also high in biological, mathematical and physical sciences (61 per cent).
Creative arts scholars were the least likely to say their subject was valued (44 per cent), with those in arts and humanities not faring much better (45 per cent).
Thomas Docherty, professor of English and comparative literature at the University of Warwick, describes these findings as “troubling”, given that unhappy workforces are “less productive and successful than when colleagues feel that they are important to their institution”.
When Universities UK welcomed the Browne Review, “essentially the sector leadership endorsed the view that arts and humanities were not important enough politically, culturally or economically to warrant the state’s financial interest – unlike STEM [science, technology, engineering and maths] subjects”, he says.
“Academic engagement with the arts and humanities tends to produce a critique of the socio-cultural status quo, but the currently prevailing drive is to produce conformity. Criticism is unwelcome, and perhaps many colleagues feel that their critical work, which is at the core of what we do, is therefore undervalued.”
Gabriel says the survey suggests that many universities are failing in what should be one of their main objectives – “maintaining a vision of every faculty and department, whether it is accounting or Byzantine studies, as having an important place in what should be commonwealths of knowledge”.
“Of course,” he continues, “departmental disputes and rivalries are inevitable in every university but effective leadership should promote a sense that, in spite of differences, we are all part of a single institution with shared values and aspirations.”
Pay variation
Although university staff are currently embroiled in a row over pay levels, with a series of strikes having taken place in recent months, after several years of below-inflation deals, 61 per cent of respondents to our survey feel that their institution offers a fair deal to employees in terms of remuneration. About a quarter (23 per cent) disagree.
Although 55 per cent of academics are content with their salaries, more than a quarter (26 per cent) express dissatisfaction. Among professional and support workers, the figures are 66 and 21 per cent respectively, suggesting that those in academic roles are more likely to feel hard done by in terms of pay.
Briner describes the findings on pay as “fascinating”. “While by any objective measure, university pay has fallen over the past couple of decades, this is not strongly reflected in respondents’ attitudes towards remuneration,” he says. “It may be that at times when staff are experiencing job insecurity, satisfaction with remuneration is more about relief at still having a job.”
Gabriel says: “I’ve been involved in five strikes over the past 35 years and the levels of anger on this occasion feel much lower than on previous occasions. I am saying this as someone who voted for strikes and has gone out on recent occasions – nobody will gain from an enduring industrial action that gradually wears out and leads to demoralisation and recrimination.”
The issue of pay nevertheless drew comment from many respondents.
“The spiralling pay gap between academic staff and senior management…is a cause for concern,” says one London-based social scientist. “How can academic staff be expected to tolerate extra demands in the name of budget cuts when our managers are being paid more than double the salary of the most distinguished academic professor?”
An Oxbridge academic, meanwhile, says her institution relies too much on its reputation. “As a result of being ‘world-class’ I feel it is expected that I should be satisfied that I work there – but actually I feel completely exploited,” the scholar says, adding: “I work as a researcher and am earning less than when I started…my university picks me up and puts me down as it sees fit.”
In terms of overall working conditions and benefits, there is a mixed picture. The majority agree with the statement “my university offers a fair deal to its employees in terms of working conditions and benefits” (61 per cent), but academics (30 per cent) were significantly more likely to disagree with this than those in other roles (18 per cent).
Staff turnover can be a source of concern for any organisation. Our findings reveal that nearly a third of university employees (29 per cent) are currently looking to leave their job (31 per cent of academics and per cent of those in other roles). About one in three (32 per cent) staff members say their job “does not feel secure”.
One Russell Group university respondent describes a “fire and rehire” approach to industrial relations that has reached an unprecedented level, while a technician at a different research-intensive institution says that “short-term contracts [are] very common…with contracts of less than three years being given out even when they have secured three years’ or more funding on that grant”.
The use of zero-hours and fixed-term contracts is a particular cause of concern for employees at universities across the country. “Short-term contracts and not necessarily feeling valued at the university level are a real problem,” says one Russell Group academic. “It’s feeling more and more like a commercial enterprise rather than a teaching and learning institute.”
Another academic, this time from a smaller research-intensive university, says: “Many staff (myself included) are on ‘permanent’ zero-hour contracts or nine-month temporary contracts. There is little job security and everyone is made aware of the fact that they are expendable.” The same respondent adds that many staff “struggle financially because of variable hours and no pay during the vacation periods”.
According to the Higher Education Statistics Agency, about two-thirds of the UK’s 181,000 university-based academics were employed on permanent contracts in 2011-12, with the remaining 36 per cent on fixed-term contracts.
Leadership and bullying
Collegiality has always played a huge part in the working environment in universities, and it appears that despite the strains placed on staff in recent years, for most, academia remains a sphere in which colleagues are supportive and positive. The vast majority of respondents in all roles (86 per cent) say they enjoy working with their immediate colleagues (83 per cent of academics and 88 per cent of professional and support staff).
But at a time of real strategic challenge, far fewer are as positive about their university’s leadership. More than a third (37 per cent) say that their institution’s senior management team is not performing well. Academics (46 per cent) were far more likely than those in other roles (30 per cent) to be critical of their university’s leadership team.
Overall, some 42 per cent say they believe their institution’s leadership team is doing a good job.
One academic at a research-intensive institution states: “The university management is making some very bad decisions without the input of those who actually teach.”
And another academic at a Welsh university claims: “Senior management are determined to push through ill-thought-out changes across the entire campus. Anyone who raises an objection or offers any form of criticism is victimised and frequently forced out of their job.”
According to Sally Hunt, general secretary of the University and College Union, the THE figures on the proportion of academics who are unhappy with their university’s leadership are “at first quite startling”. Yet, she adds, “the truth is that recent years have seen an abject failure of leadership from vice-chancellors. They have been too busy fighting each other to fight for the sector, and too often ask others to do what they themselves would not do. There is no better example of this breakdown of trust than the rank hypocrisy shown by vice-chancellors telling their staff to take a real-terms salary cut while themselves receiving inflation-busting pay rises.”
Departmental leaders fare better than those at institutional level, with 50 per cent of our sample saying their department managers are performing well (53 per cent of professional and support staff, and 47 per cent of academics). However, more than a third (34 per cent) say their departmental managers are not performing well, with academics (37 per cent) particularly unimpressed.
“Within my department there is poor morale, cases of bullying, distinct favouritism and unequal workload allocation,” says a London-based lecturer. “[It’s] hard to resolve this as some of the people in power are the offenders.”
In total, there were more than 100 comments referring to institutionalised bullying or the victimisation of staff members.
An administrator at one post-1992 institution sums up many of the concerns discussed. “There is a high level of bullying that takes place within the institution and it is always the victim that leaves and moves on,” she says.
“Some bullies have had complaints raised about them on numerous occasions but the institution does nothing about it. It’s almost like management are actually scared to take on the bullies and question their behaviour.”
Meanwhile, a manager at another university describes high levels of bullying, being told to keep quiet, “forced ‘gardening leave’ [and] intimidatory behaviour by senior managers”, while an academic at a Welsh university laments “bullying by middle management to get the results senior management want”, alleging that the practice had even led to “mark manipulation”.
Is your voice heard?
Any management textbook will emphasise the importance of giving staff a “voice” within their organisation. Yet almost 40 per cent of university employees say they feel unable to “make their voice heard” within their institution, with the figure standing at 34 per cent for those working in professional and support roles and 46 per cent for academics.
“There is very little opportunity for genuine academic voice at either departmental or college level,” comments one scholar. “On two occasions when I’ve raised issues unpopular with the head of school (regarding the research excellence framework and an internal reorganisation), he’s actually shouted at me.”
“Academics in particular have little voice within the university and departments have very little autonomy, despite functioning better when afforded a degree of decision-making power and understanding what works best for them,” one Russell Group scholar states.
Gabriel believes that this finding is particularly important in a profession based on collegiality. “The fact that 46 per cent of academics claim that they feel unable to make their voices heard in their institution may be the most significant single finding in this survey,” he says. “They, along with their peers, have now had an opportunity to express their views.”
Would you recommend your institution?
Finally, to gauge the overall atmosphere of each university, we asked respondents whether they would recommend working at their institution to others.
Although nearly a quarter of staff (24 per cent) say they would not, the majority (59 per cent) would. Professional and support staff (66 per cent) are far more likely than academics (50 per cent) to make such a recommendation. One in five (19 per cent) professional and support staff say they would not recommend their institution to others, compared with 30 per cent of scholars.
Some professional and support staff responded at length about their reasons for not recommending their institution to others, including an administrator at a London university. “The university’s preoccupation with league tables, etc, at the expense of staff well-being is misguided and insulting,” she says. “As a result, some of the most enthusiastic and talented staff members are leaving. We are restructured practically every year so I would not recommend this to others as a good place to work.”
Other staff gave their university strong praise. One academic working in engineering and technology, for example, argues that his university “provides good-quality education that is relevant to future careers across a wide range of professions”owing to strong links with industry, while maintaining “a strong commitment to student satisfaction”. He also notes that “management recognises that the higher education sector has changed dramatically over the past decade and so financial stability and strength of the institution are key drivers for policymaking”.
Some respondents, meanwhile, chose to highlight the dedication of their colleagues. “The university is very effective at providing high-quality and appropriate learning experiences…It is the commitment and goodwill of all staff that ensures this, and the esteem in which many hold the university strongly contributes to this. I work with people who really care about the students. Although somewhat reduced, there is still a strong team-working and collegiate ethos,” says one academic working in a department of education at a specialist institution.
The inaugural THE Best University Workplace will inform THE’s editorial content throughout 2014, and this unique window into working life within the sector will help to hold institutions to account as well as recognising those that exemplify good practice.
“The survey offers some serious recognition of the hard work and great contribution of those working in institutions that do not frequently catch the limelight in more traditional surveys and ranking exercises,” Gabriel says.
The Times Higher Education Best University Workplace Survey 2015 will be rolled out later this year.
THE Best University Workplace Survey methodology
To compile the inaugural Times Higher Education Best University Workplace Survey, we canvassed the opinions of 4,584 higher education employees from across the UK between July and September 2013.
Of those, 2,081 (45 per cent) describe themselves as “academics”, with the other 2,503 (55 per cent) saying that they work in “professional and support” roles.
Each respondent was given 29 statements about their institution, such as “I would recommend working at my university to others”. They were then asked to indicate the extent to which they agreed or disagreed with the statement on a five-point Likert scale: strongly disagree, disagree, neither agree nor disagree, agree, or strongly agree.
The survey also allowed those taking part to make written comments about their institution in three categories: things my university does well; areas in which my university could improve; and an open box for any further comments.
To ensure respondents did not complete the survey multiple times, and were affiliated to a university, only people with a working “.ac.uk” email address could take part. The owner of each email address could complete the survey only once.
The independent online survey was developed by THE in consultation with Rob Briner and Yiannis Gabriel, professors at the University of Bath School of Management, and after a discussion held with individuals from professional bodies and trade unions including the University and College Union, the Association of University Administrators and Universities UK.
Survey respondents came from 150 UK higher education institutions. When compiling the “top five” tables (see ‘Top achievers: institutions that are getting it right’ box), THE included only universities where at least 25 staff had completed the survey. A total of 52 institutions met this benchmark, and the approval rating for each category was derived from the number of people indicating that they “agreed” or “strongly agreed” with the given statements.

Top achievers: institutions that are getting it right
The results of the Times Higher Education Best University Workplace Survey reaffirm that the University of Huddersfield, named Click here for additional top 5 tables

Job satisfaction: as happy as a florist?
Although job satisfaction appears to run high among those working in higher education, how do levels of satisfaction compare with those in other sectors?
The Career Happiness Index 2012, which was compiled by City & Guilds, and based on the opinions of 2,200 workers, provides one source of comparison.
Times Higher Education asked staff whether they agree with the statement “my work is a source of satisfaction to me”, whereas the Career Happiness Index asked respondents how “happy” they were in their work.
In THE’s survey, 85 per cent of academics and 78 per cent of those in professional and support roles agree that they derive satisfaction from their work.
Although not a direct comparison, in the Career Happiness Index, gardeners and florists give a similar rating, with 87 per cent stating that they are “happy”.
The City & Guilds index does not include “academics” or “university staff” as a category but it does give a figure for scientists and researchers, 69 per cent of whom rate themselves as “happy”.
They are less content, however, than hairdressers and beauticians (79 per cent), plumbers (76 per cent) and those in marketing and PR (75 per cent), but more content than teachers (59 per cent).
Propping up the City & Guilds list are bankers and IT/telecoms workers; only 44 and 48 per cent, respectively say that they are happy in their work.

Research excellence framework: negative effect on work
The deadline for submissions to the 2014 research excellence framework passed last autumn, bringing to an end one of the most stressful events on the higher education calendar.
At the time, a Times Higher Education straw poll of pro vice-chancellors revealed that the process had been every bit as draining as the 2008 research assessment exercise, despite changes that were intended to make the process less burdensome to administer.
In keeping with this, the Best University Workplace Survey tells us that more than a third of academics (35 per cent) believe that their institution’s response to the REF has had a negative impact on their work. Here is what some of them had to say:
- “Too much obsession with league tables and REF scores to the detriment of students and staff. Big reductions in admin support staff have led to a massive increase in academics spending time doing things they are not too good at!” – academic, Russell Group university.
- “Morale is low among those worried about the REF, but I think that is true everywhere” – lecturer, Scottish university.
- “It is not a nice place to work at the moment, there is a culture of management nastiness, everyone is stressed over the REF, and there is talk about lots of jobs being under threat if we don’t do well in the REF and get student numbers up” – academic, Russell Group university.
- “Research, and the REF focus, detaches active researchers from engaging with colleagues who have high teaching loads” – academic, post-1992 university.
- “Those of us who have contributed to the REF have done so by squeezing research into our own time. There is no quiet space to work…the library and electronic resources are not very useful/helpful for a serious researcher!” – academic, specialist university.
- “The REF has not been well handled, as guidelines have been unclear and getting advice from the department, school and university level has been difficult” – academic, London university.
- “Bad teaching and a ‘don’t care’ attitude is not punished at institutions that only care about income at the REF. This seems to have been a problem with ALL the universities I have worked for” – academic, research-intensive institution.
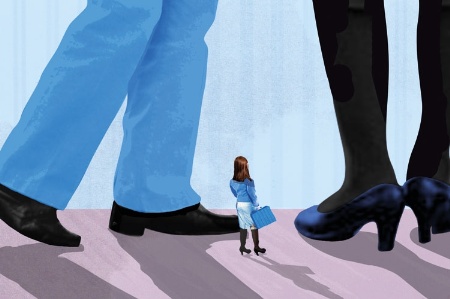
Equal opportunities: still room for improvement
With women making up only 20 per cent of professors and 14 per cent of vice-chancellors, the “glass ceiling” has yet to be shattered in UK universities.
We asked survey participants what they thought about the equal opportunities policy at their institution.
About two-thirds of respondents (63 per cent) say they feel that their university has a fair and effective equal opportunities policy, with the figure marginally higher among women (65 per cent) than men (61 per cent). Among academics only, however, men are more likely than their female counterparts to rate their university’s policy positively, with approval rates of 55 and 51 per cent, respectively. For those in professional and support roles, the opposite is true, with 69 per cent of men saying their institution’s approach to equal opportunities is fair, compared with 72 per cent of women.
While most respondents were positive, one in seven (14 per cent) expressed concern about equality of opportunity in the workplace.
Among them was an administrator at a research-intensive university in southern England, who says her institution has “a published equalities policy but manifestly unequal practices”.
“[My university] worries officially about equality…but doesn’t include administrators in this category, nor how their policies affect female professional support staff who make up 95 per cent of these jobs. It officially worries about equalities only in so far as it applies to academic staff,” she claims.
A Russell Group academic says the number of women in management positions at her institution is “dreadfully low”. “No female vice-presidents, only two deans and precious few heads of department,” she says, describing the university as having “an incredibly macho environment”.
“The problem then is the impression conveyed to students. Power is male, so don’t aspire to manage things if you are a girl. [This is] not really what we ought to be saying to the next generation of women,” she adds.
Another Russell Group academic says that his university suffers from “a terrible staff gender balance, especially at senior levels, which probably detrimentally affects everyday decision-making and certainly means women students do not enjoy the presence of many positive role models”.
Some respondents also raised concerns about the treatment of lesbian, gay, bisexual and transgender staff.
“As far as I am aware, the university has no anti-homophobic bullying policies in place or any associated staff training to help them identify and deal with these issues when encountered within the student or staff communities,” says one Scotland-based academic. “There [have been] no efforts to tackle this within the university or make any attempts to make the workplace more inviting or attractive to LGBT academics.”
At a London university, one academic reports that the many departments are “heavily male dominated”, and that the understanding of equality and diversity is “minimal” at best. “Heads of department, deans…do not encourage female/black and minority ethnic/disabled/LGBT staff much,” she claims, echoing concerns expressed by other survey participants.
The good…
“I think our university cares for its employees, it’s not too big, while giving students a wonderful experience. We are doing well with recruitment and retention of students”
Senior manager, specialist university
“The university does a great job of putting students first, and I feel that everyone from the top down wants to offer students the best experience we can”
Lecturer, specialist university
“Permanent contracts for all post-docs shows it cares for the weakest in this sector”
Professor, post-92 university
“A vibrant place that really cares and supports its staff and students and is a fully integrated, valued and treasured aspect of the local community”
Administrator, Welsh university
“The university is a safe, supportive working environment, my personal development seems to matter and relationships with colleagues are valued”
Administrator, Russell Group university
…and the bad
“[There is] fear of the v-c and their ruthlessness – they brook no opposition”
Manager, research-intensive university
“We no longer receive financial support towards the cost of doing fieldwork, archival research or attending conferences, therefore I use my own salary to subsidise my employer. Yet the research I do is to be submitted to the research excellence framework”
Academic, Welsh university
“There is a terrible culture of bullying which is condoned by senior management. The way human resources deals with harassment and discrimination is unspeakably bad – I have never encountered worse HR operations”
Academic, Russell Group university
“Instead of reciting the mantra ‘do more with less’, [my university should] assess workloads and stop asking staff to do everything with a diminishing resource base”
Manager, Scottish university
“I have worked here for decades and never in all that time have I witnessed so many totally stressed, demoralised and unhappy staff. Why can’t they realise that they will get back 10 times what they give if they treat staff decently?”
Administrator, Northern Irish university
“The university needs to work further on its response to harassment and discrimination, in particular in relation to young, female academics”
Academic, Russell Group university
“Catering is awful on campus. Need better food”
Manager, Russell Group university

Register to continue
Why register?
- Registration is free and only takes a moment
- Once registered, you can read 3 articles a month
- Sign up for our newsletter
Subscribe
Or subscribe for unlimited access to:
- Unlimited access to news, views, insights & reviews
- Digital editions
- Digital access to THE’s university and college rankings analysis
Already registered or a current subscriber?